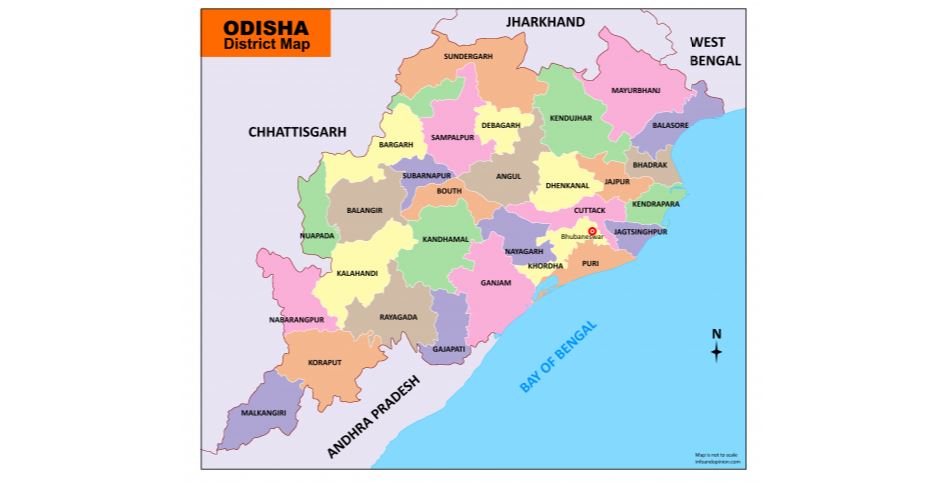
Muslim Population in Districts of Odisha
In this Article Data about the Muslim Population in Districts Of Odisha is given In Table Format. Demographics, Percentage & Key Insights About Muslim Population also Provided.
| District Name | Total Population | Muslim Population | Muslim Percentage |
|---|---|---|---|
| Bargarh | 1481255 | 7527 | 0.51 |
| Jharsuguda | 579505 | 12783 | 2.21 |
| Sambalpur | 1041099 | 20120 | 1.93 |
| Debagarh | 312520 | 704 | 0.23 |
| Sundargarh | 2093437 | 71391 | 3.41 |
| Kendujhar | 1801733 | 27752 | 1.54 |
| Mayurbhanj | 2519738 | 33706 | 1.34 |
| Baleshwar | 2320529 | 94254 | 4.06 |
| Bhadrak | 1506337 | 104202 | 6.92 |
| Kendrapara | 1440361 | 50247 | 3.49 |
| Jagatsinghapur | 1136971 | 46929 | 4.13 |
| Cuttack | 2624470 | 141263 | 5.38 |
| Jajapur | 1827192 | 93642 | 5.12 |
| Dhenkanal | 1192811 | 4805 | 0.40 |
| Anugul | 1273821 | 7512 | 0.59 |
| Nayagarh | 962789 | 5278 | 0.55 |
| Khordha | 2251673 | 84060 | 3.73 |
| Puri | 1698730 | 46094 | 2.71 |
| Ganjam | 3529031 | 13315 | 0.38 |
| Gajapati | 577817 | 1556 | 0.27 |
| Kandhamal | 733110 | 2138 | 0.29 |
| Baudh | 441162 | 1007 | 0.23 |
| Balangir | 1648997 | 7811 | 0.47 |
| Nuapada | 610382 | 4952 | 0.81 |
| Kalahandi | 1576869 | 4975 | 0.32 |
| Rayagada | 967911 | 4607 | 0.48 |
| Nabarangapur | 1220946 | 6753 | 0.55 |
| Koraput | 1379647 | 8850 | 0.64 |
| Malkangiri | 613192 | 1871 | 0.31 |
| Subarnapur | 610183 | 1566 | 0.26 |